
OpenWGA 7.5 - OpenWGA Concepts and Features
Design and development » TMLScriptDebugging
An integrated Debugger is available for TMLScript of OpenWGA runtimes which run inside OpenWGA developer studio. The debugger features a GUI where you can process the TMLScript statements of your code step by step and are able to evaluate the scope objects of the script.
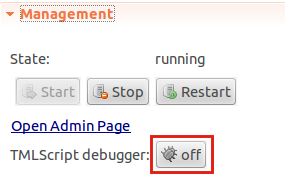
The TMLScript debugger can be enabled either "on demand" for a running OpenWGA server using the runtime configuration. Double-click the "runtime.xml" file in the studio to open it. On tab "Status" you will find a button to bring up the debugger. It is only usable while the OpenWGA server is currently running for this runtime:
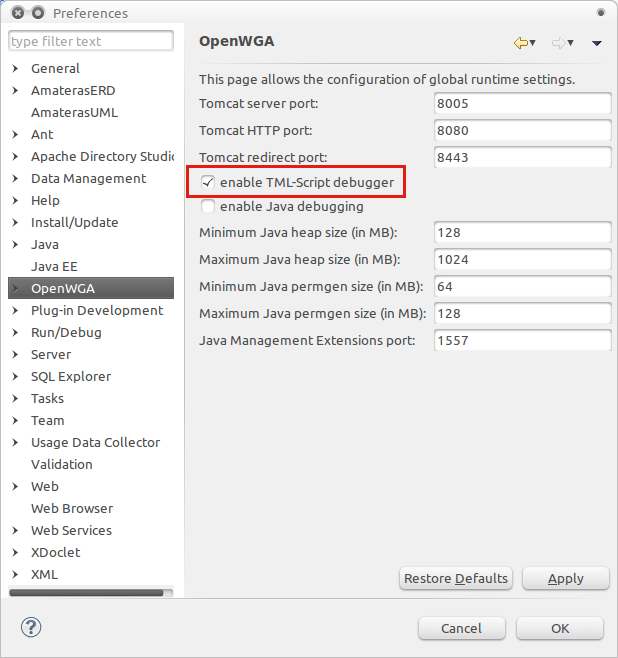
Alternative you can configure the developer studio to automatically start every OpenWGA server with enabled debugger. Open menu "Windows > Preferences", then navigate to the node "OpenWGA" in the left hand tree structure. In the editor check "enable TMLScript debugger".
Setting breakpoints
Breakpoints mark statements in TMLScript code where the execution should stop and the debugger UI should offer the designer to step through further execution.
The debugger UI supports setting breakpoints by clicking the left frame of the editor window next to the statement where the break should occur. It also supports breaking the next execution by clicking the "Break" button. But both variants are often not really useful. The first needs the code to be open in editor - where it is often impossible to find the right code. The second breaks some random statement that happens next. This may be your next request but also some other script that is scheduled.
The best way to break execution at a certain step is to use the statement runtime.debug() inside the TMLScript code that is executed:
runtime.debug();
The debugger will halt immediately at that statement, allowing you to step throught the following process.
The statement "runtime.debug()" has no effect on OpenWGA runtimes that have no debugging enabled and is quietly ignored. So while it may not be recommended to keep these in code when they become productive it also is not fatal if any of these statements accidentally reach productive systems.
Usage
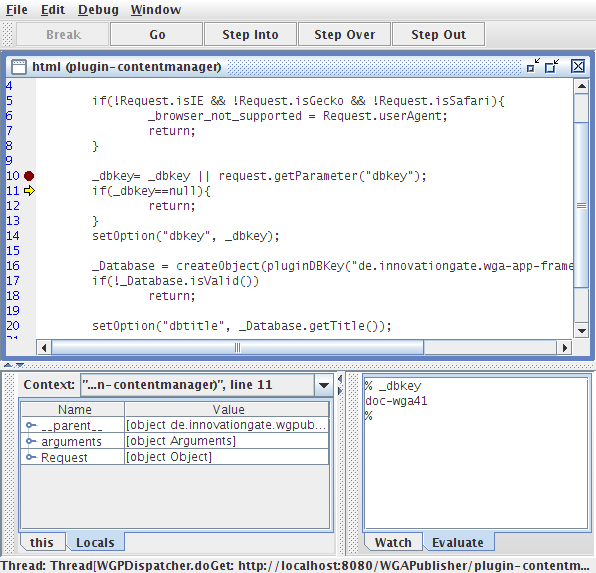
The TMLScript debugger UI consists of the following elements:
At the center there is the editor which contains separate code windows for all scripts that already have been run on the server. Many of these are surrounded by a function definition called "_tmlscript()" that is built by OpenWGA internally.
The buttons over this central editor have the following purposes:
- Break lets the UI halt on the next TMLScript execution
- Go lets a halted script continue to process normally without debugging until another breakpoint is reached
- Step into executes the next statement and optionally goes "into" a subroutine that is executed by it
- Step over executes the next statement but does not enter subroutines
- Set out leaves the current script and continues stepping on the routine that called the current one (if there is any)
The section to the bottom left contains two tabs. The tab this shows information about the current "this" object, which in TMLScript normally is the TMLContext and provides no useful information. The tab locals shows all the available JavaScript variables of the local scope and their values.
The section to the bottom right again contains two tabs. The tab watch alles you to define TMLScript expressions that are evaluated constantly while stepping through the code and shows you their current values. The tab evaluate often proves to be the most useful one. It is some kind of TMLScript console where you can issue any statement and are returned the result. So here you can evaluate the current TMLScript environment in detail.